Host your own Mapbox GL JS vector tiles map
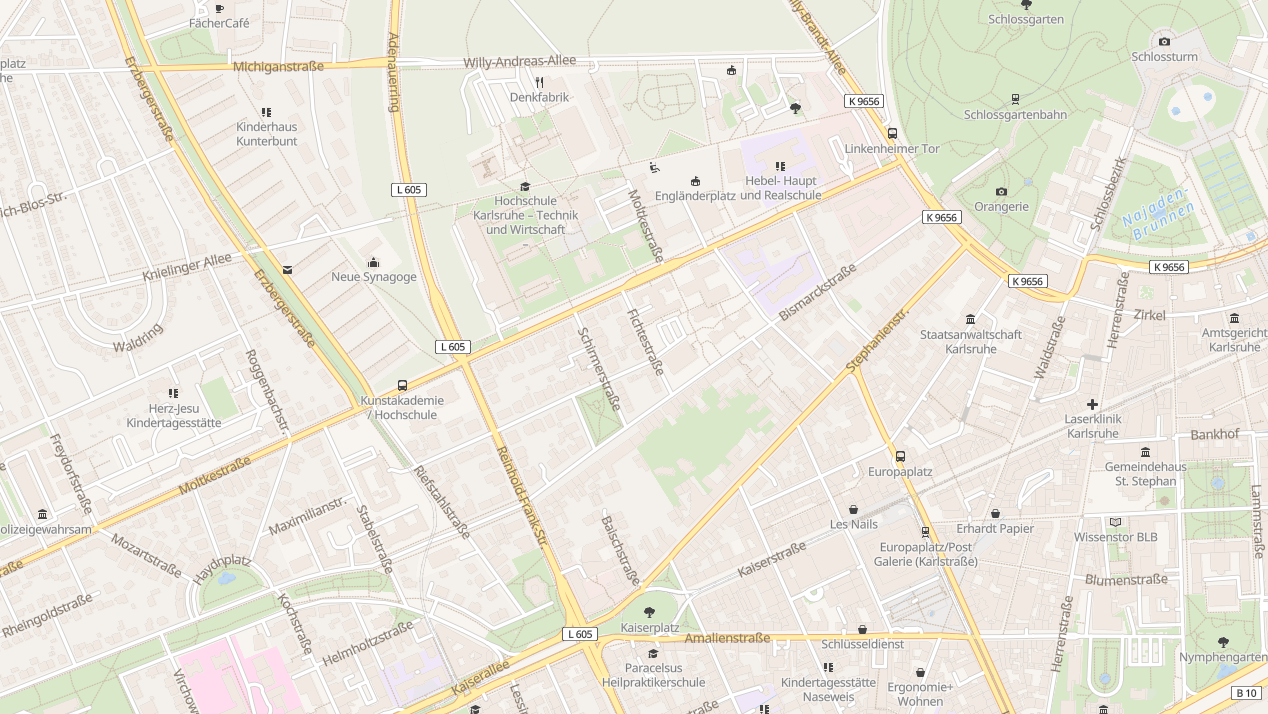
I’ve done some research recently on how I could host my own online map viewer with a MapBox GL JS instance, an excellent and modern open-source alternative for Google Maps. The server should also serve own preprocessed map data from OpenStreetmap planet extracts. No external or third-party service will be required, see the demo here (higher zoom levels are online available for the city Karlsruhe).

In the following part, I’m going to show how to generate own vector tiles for the backend map server and how to setup a running demo instance of MapBox GL JS which will be using our own map data.
Generate vector tiles
Usually, we would download the raw Openstreetmap data extract of a specific region and maybe further “crop” or shrink it to a smaller part to save computation time. For the city Karlsruhe, I took the geographic coordinates or boundaries of Karlsruhe from this page. Generating the vector tiles from this data set would be very easy with the OpenMapTiles framework:
pacaur -S osmconvert
git clone https://github.com/openmaptiles/openmaptiles.git
cd openmaptiles
make
mkdir data
wget "https://download.geofabrik.de/europe/germany/baden-wuerttemberg/karlsruhe-regbez-latest.osm.pbf"
osmconvert karlsruhe-regbez-latest.osm.pbf -b=7.893,48.73,8.816,49.246 -o=data/karlsruhe-latest.osm.pbf
sed -i "s/QUICKSTART_MAX_ZOOM=.*$/QUICKSTART_MAX_ZOOM=14/g" .env
./quickstart karlsruhe-latest
Before starting the quickstart script with my custom extract file name, I also set the maximum depth of detail (max zoom = 14). Unfortunately the quickstart script has a bug with custom extracts and it will need a complete rework to function again. So the manual workaround to do this is a bit more complex:
git clone https://github.com/openmaptiles/openmaptiles.git
cd openmaptiles
./quickstart.sh karlsruhe-regbez
cp ./data/docker-compose-config.yml karlsruhe-config.yml
Again, I’m using the quickstart script and generate vector tiles for a predefined region. Copy and modify the standard config according to your BBOX (smaller boundaries), the name of the extract and the zoom level (higher zoom level means more computation time).
version: "2"
services:
  generate-vectortiles:
    environment:
      BBOX: "7.893, 48.73, 8.816, 49.246"
      OSM_MAX_TIMESTAMP : "2018-10-27T19:37:25Z"
      OSM_AREA_NAME: "karlsruhe"
      MIN_ZOOM: "0"
      MAX_ZOOM: "14"
QUICKSTART_MIN_ZOOM=0
QUICKSTART_MAX_ZOOM=14Start generating the vector tiles using the OpenMapTiles schema:
docker-compose up -d postgres
docker-compose -f docker-compose.yml -f ./karlsruhe-config.yml run --rm generate-vectortiles
docker-compose run --rm openmaptiles-tools generate-metadata ./data/tiles.mbtiles
docker-compose run --rm openmaptiles-tools chmod 666 ./data/tiles.mbtiles
cp ./data/tiles.mbtiles ./data/karlsruhe.mbtiles
The compiled vector tiles can be directly tested with the included tile server:
make start-tileserverSetup Mapbox GL JS frontend
The frontend example code (see demo link above) is available in our Gitlab repository. Everything you need to host this demo is a web server with Php support and an Sqlite module. Further copy the vector tiles file “karlsruhe.mbtiles” into the tileserver subdirectory.
cd /var/www
pacman -S php-sqlite
git clone https://git.project-insanity.org/onny/web-mapbox-gl-js-offline-example.git
mv /tmp/karlsruhe.mbtiles web-mapbox-gl-js-offline-example/tileserver/
Don’t forget to enable the PHP Sqlite module in your php.ini file:
[...]
extension=sqlite3
extension=pdo_sqlite
[...]
Following urls need to be changed according to your domain name (e.g. to localhost or example.com) in the style.json file:
  "sources": {
    "openmaptiles": {
      "type": "vector",
      "tiles": ["https://onny.project-insanity.org/mapbox-gl-js-offline-demo/tileserver/tileserver.php
?/index.json?/karlsruhe/{z}/{x}/{y}.pbf"],
      "minzoom": 0,
      "maxzoom": 14,
      "attribution": "© OpenMapTiles © OpenStreetMap contributors
"
    }
  },
  "sprite": "https://onny.project-insanity.org/mapbox-gl-js-offline-demo/json/sprite",
  "glyphs": "https://onny.project-insanity.org/mapbox-gl-js-offline-demo/fonts/{fontstack}/{range}.pbf
",
Note that the tiles url also contains a reference to the “karlsruhe.mbtiles” file. The min- and maxzoom properties are very important if you want to be able to “overzoom” your map above the zoom level 14. It does not define zoom restrictions in the Mapbox GL JS interface. Here, the maxzoom property should not be higher than the maxzoom level of your generated vector tiles. Otherwise the tileserver will serve “empty” tilesets which will result a blank view in Mapbox GL JS.
I forked the original OSM Bright map style from here.
Update: This post got featured in WeeklyOSM #433 in November 2018.